Downloads
SAS Graphics Macros (3):
SAS Macros for Latent Class Analysis Plots (v. 2.0)
Users’ Guide:
Users’ Guide (v. 2.0)
Sample Code:
Sample Code & Simulated Data
Recommended Citations
SAS Graphics Macros for Latent Class Analysis (Version 2.0) [Software]. (2015). University Park: The Methodology Center, Penn State.
Dziak, J. J., & Lanza, S. T. (2015). SAS graphics macros for latent class analysis users’ guide (Version 2.0). University Park: The Methodology Center, Penn State.
IdentificationPlot

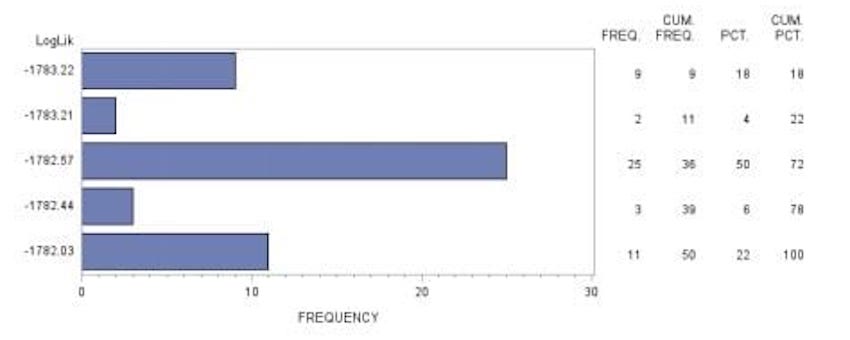
Identification plot to judge how well-identified a latent class model is. This macro plots the distribution of fitted log-likelihoods resulting from multiple starting values.
The plot above (click graphic to view larger) illustrates a rather well-identified model; most of the starting values agree and give the best solution available, although some give suboptimal solutions.
PROC LCA DATA=data1 OUTSEEDS=ID;
NCLASS 4;
ITEMS childcog soccog childbeh singlerisk famdemo strsspt momdep histprob marrisk parrisk neirisk classrisk schlrisk;
CATEGORIES 2 2 2 2 2 2 2 2 2 2 2 2 2;
SEED 28214;
NSTARTS 20;
RUN;
%INCLUDE ‘C:\LcaGraphicsV1.sas’;
%IdentificationPlot(SeedsDataset=ID);
ItemResponsePlot

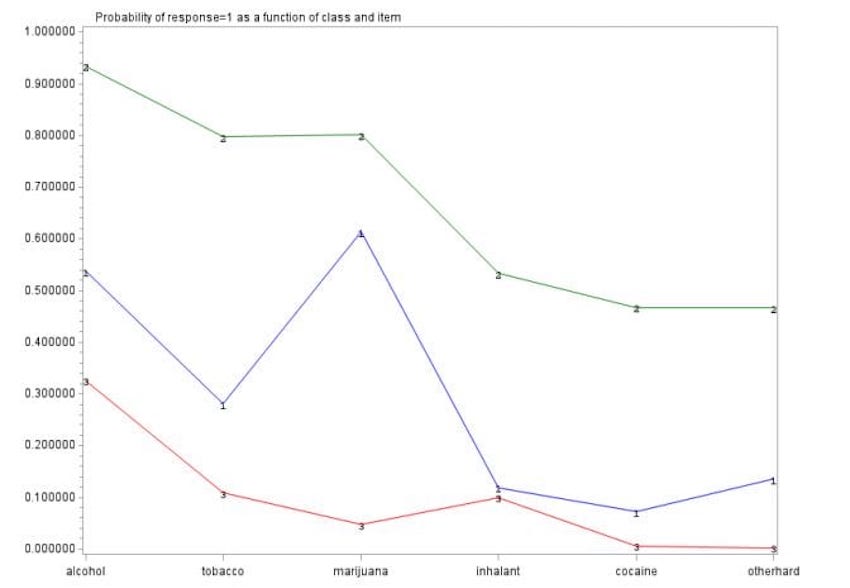
Item response plot to show the characteristics of different latent classes quickly by graphically summarizing the pattern of response probabilities for each latent class.
Each profile represents the response pattern of a latent class.
PROC LCA DATA=data1 OUTPARAM=param;
NCLASS 4;
ITEMS childcog soccog childbeh singlerisk famdemo strsspt momdep histprob marrisk parrisk neirisk classrisk schlrisk;
CATEGORIES 2 2 2 2 2 2 2 2 2 2 2 2 2;
SEED 28214;
RUN;
%INCLUDE ‘C:\LcaGraphicsV1.sas’;
%ItemResponsePlot(ParamDataset=param);
OddsRatioPlot

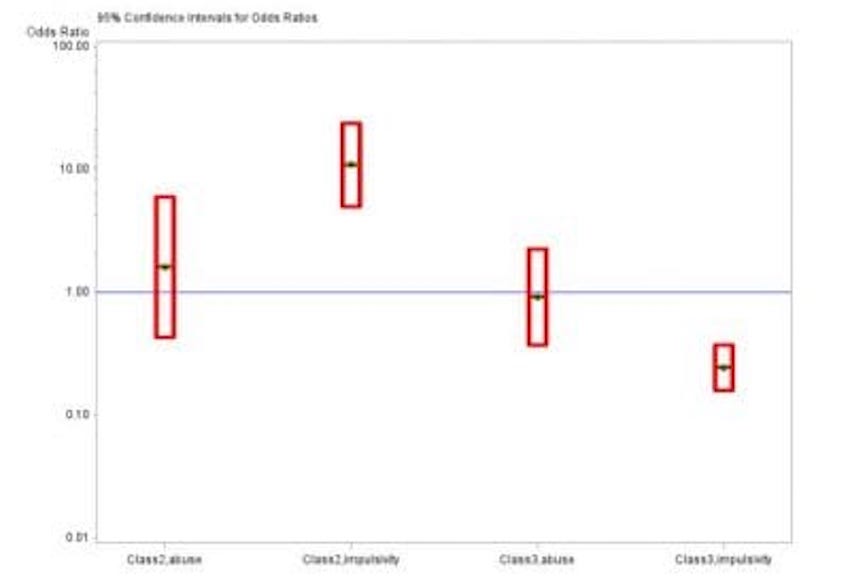
Odds ratio plot to show confidence intervals for the odds ratios associated with each covariate.
PROC LCA DATA=data1 OUTPARAM=param1 OUTSTDERR=stderr1;
NCLASS 4;
ITEMS childcog soccog childbeh singlerisk famdemo strsspt momdep histprob marrisk parrisk2 neirisk classrisk schlrisk;
CATEGORIES 2 2 2 2 2 2 2 2 2 2 2 2 2;
COVARIATES behav abuse;
SEED 28214;
RUN;
%INCLUDE ‘C:\LcaGraphicsV1.sas’;
%OddsRatioPlot(ParamDataset=param1,
StdErrDataset=stderr1);
Let’s stay in touch.
We are in this together. Receive an email whenever a new model or resource is added to the Knowledge Base.
